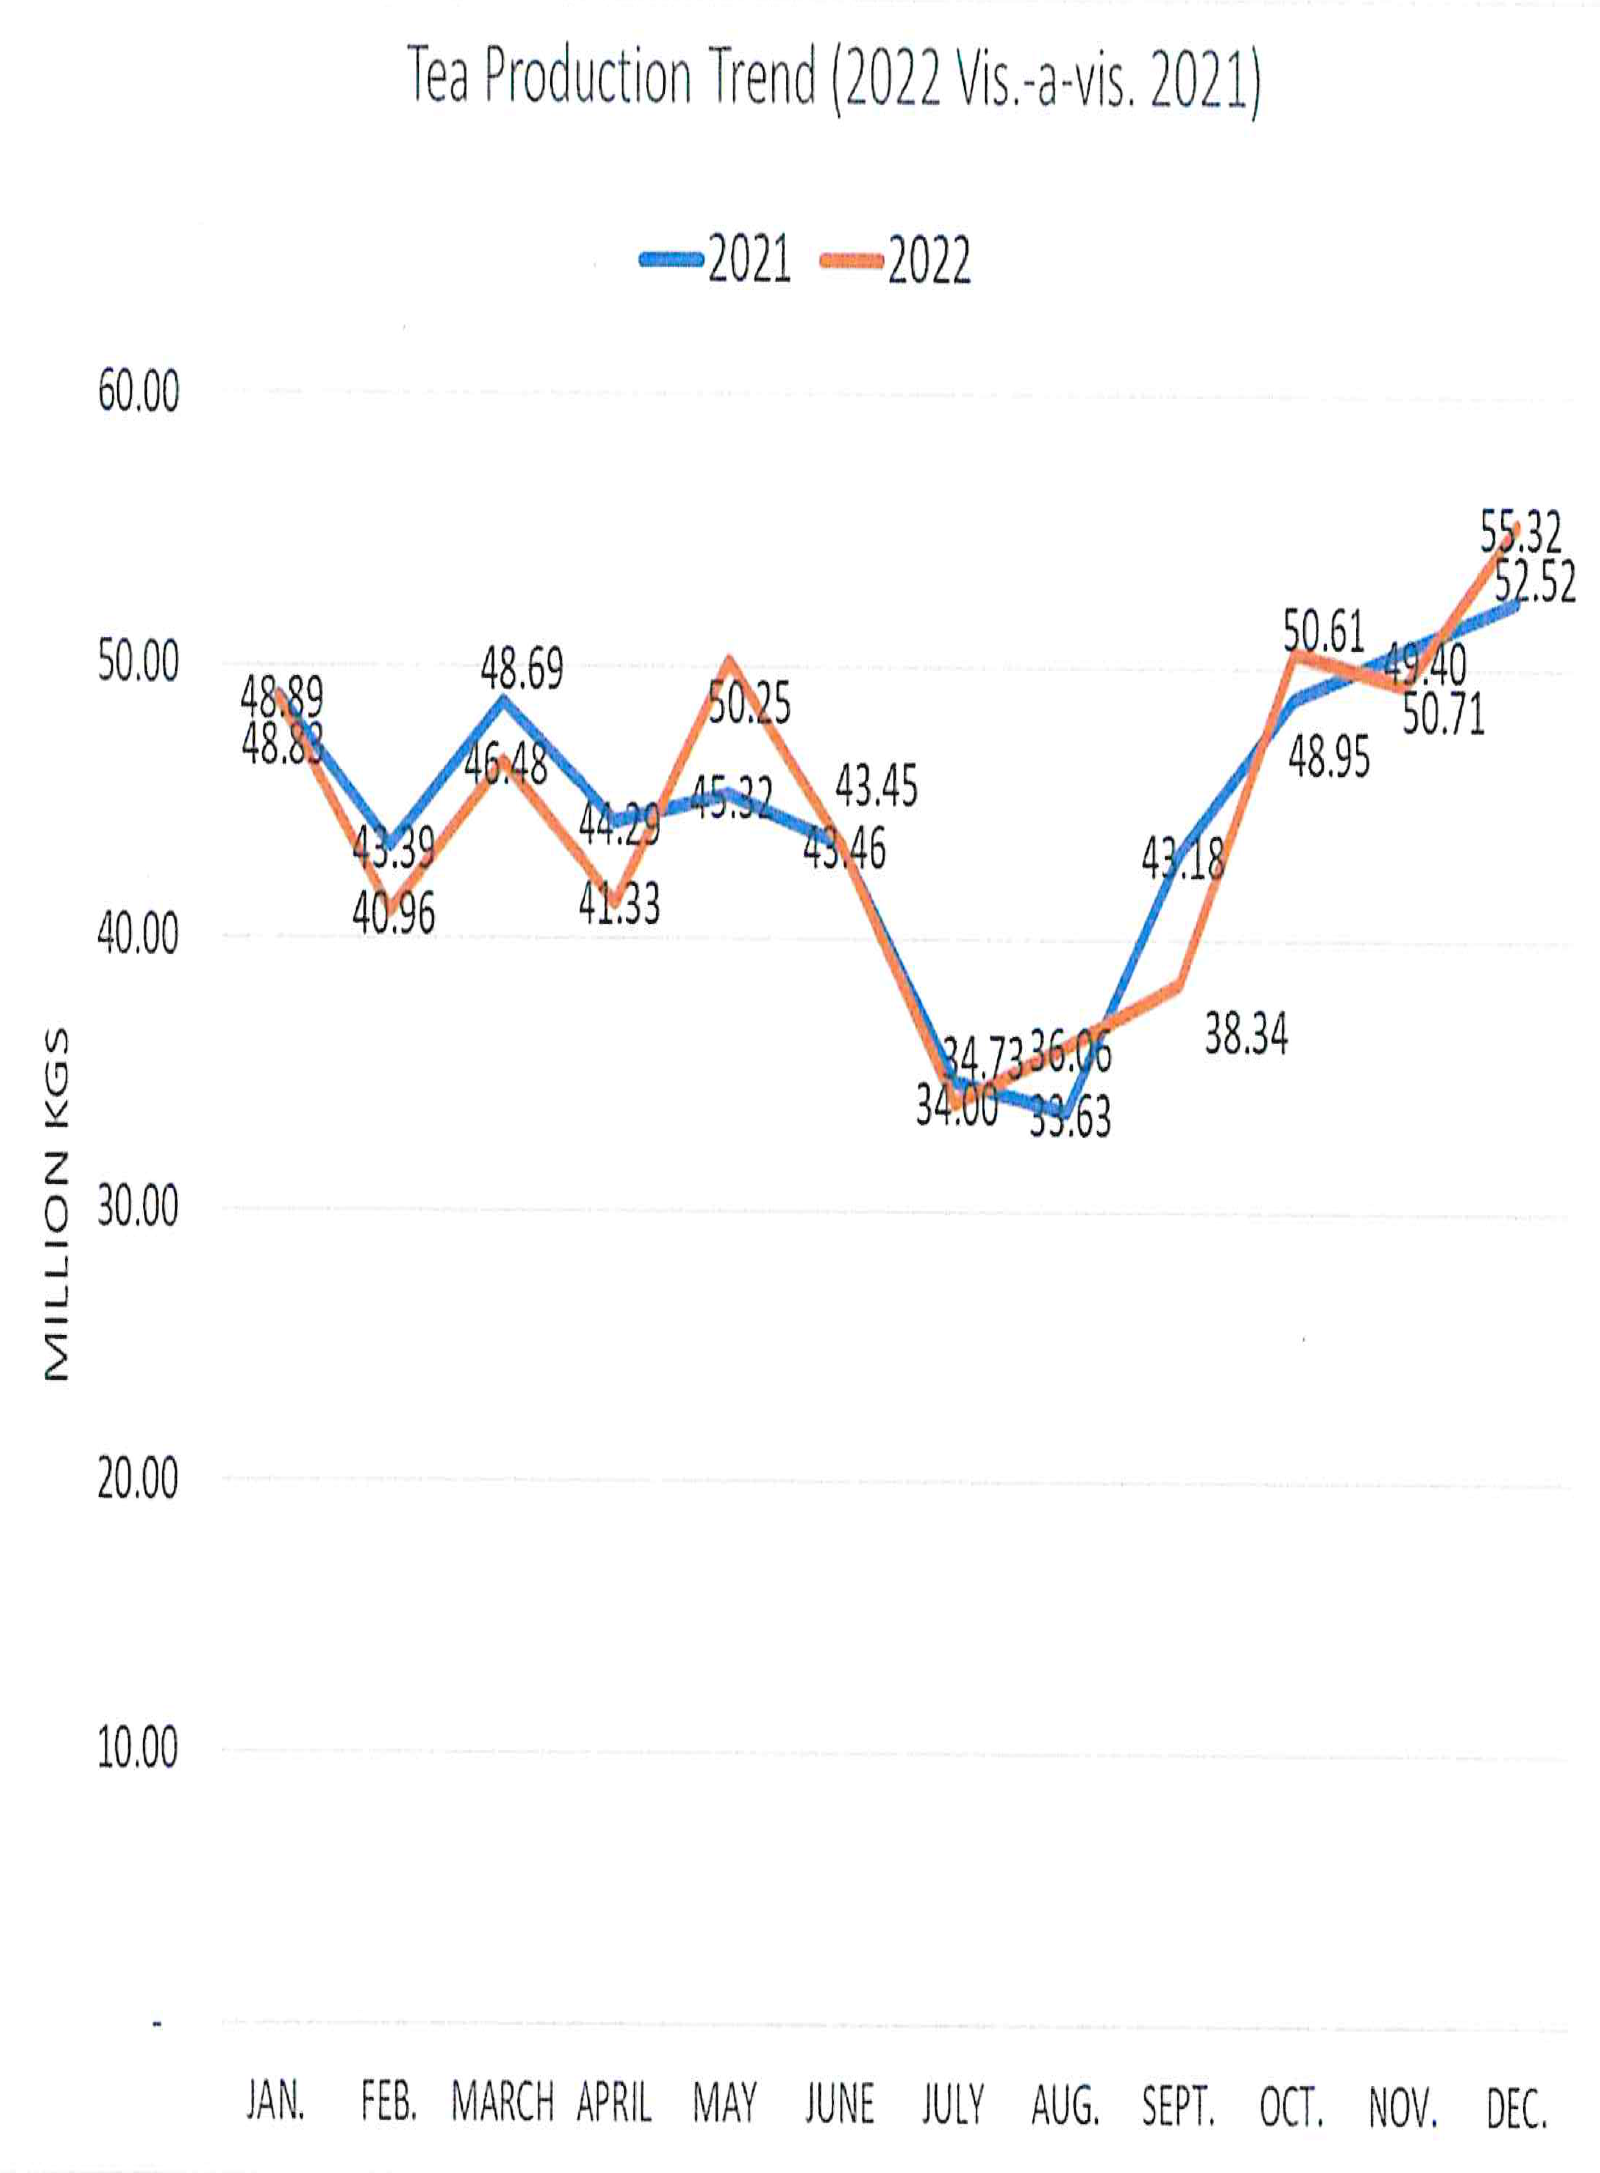
Tea production for the month of December 2022 was enhanced by 2.79 Million Kgs from 52.52 Million Kgs recorded in the same month of 2021 to 55.32 Million Kgs. Production for the month of December was also higher compared to that of November which recorded 49.40 Million Kgs. Improved production for the month of December follows enhanced rainfall in most parts of the country compared to the months of November 2022 and December 2021.
Table 1: Production by Sub-Sector and Region (2022 vis-à-vis 2021)
|
Sub-Sector |
Re ion |
December-22 |
December-21 |
Variance |
Var. % |
Jan - Dec 2022 |
Jan - Dec 2021 |
Variance |
Var. % |
|
Plantation |
West of Rift |
22,809,746 |
20,715,133 |
10.11% |
242,922,827 |
234,728,728 |
8,194,099 |
3.49% |
|
|
East of Rift |
2,431 ,901 |
796,866 |
48.74% |
18,285,532 |
1.008,974 |
5.52% |
|||
|
Total |
25,241,647 |
2,891 ,479 |
12.94% |
262,217,332 |
253,014,260 |
9,203,073 |
3.64% |
||
|
Smallholder |
West of Rift |
12279.780 |
-13.74% |
118,937 ,029 |
4,567,915 |
-3.70% |
|||
|
East of Rift |
19,488,074 |
17,896,408 |
8.89% |
153,889,334 |
161,313,636 |
-4.60% |
|||
|
Total |
30,080,967 |
95,221 |
-0.32% |
272,826,363 |
284,818,579 |
-4.210/0 |
|||
|
Plantation & Smallholder |
West of Rift |
32,994,913 |
407,726 |
1.24% |
3,626, 184 |
1.01% |
|||
|
East of Rift |
21 |
19,531 ,443 |
2,388,532 |
12.23% |
173,183,840 |
179,599,167 |
6,415,327 |
-3.57% |
|
|
Total |
55,322,615 |
52,526,356 |
2,796,259 |
5.32% |
535,043,695 |
537,832,839 |
2,789,144 |
-0.52% |

![]() Download Kenya Tea Industry Performance Report - 2022 December (907KB)
Download Kenya Tea Industry Performance Report - 2022 December (907KB)


